Resources
Explore a wide range of valuable resources on GCED to deepen your understanding and enhance your research, advocacy, teaching, and learning.
12 Results found
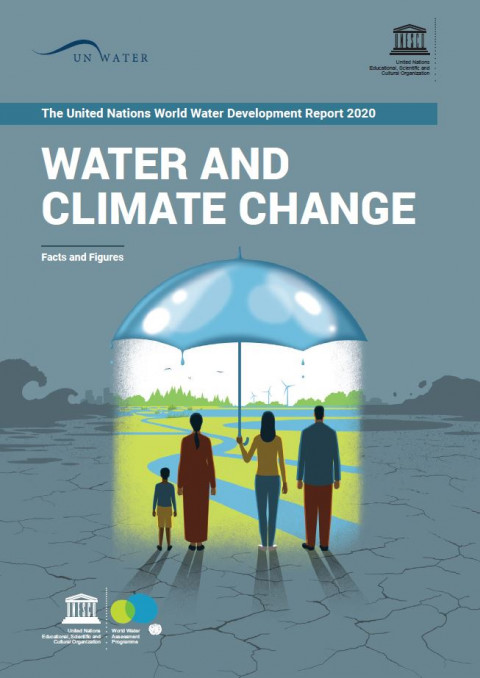 [Facts and Figures] The United Nations World Water Development Report 2020: Water and Climate Change; Facts and Figures Year of publication: 2020 Author: Engin Koncagül | Michael Tran | Richard Connor Corporate author: UNESCO World Water Assessment Programme (WWAP) Since the mid-20th century, changes in the intensity and frequency of extreme weather and climate events have been observed, including a decrease in cold temperature extremes, an increase in warm temperature extremes, an increase in extremely high sea levels and an increase in the number of heavy precipitation events in a number of regions (Min et al., 2011).Climate projections indicate with high confidence that extreme precipitation events will become more intense and frequent in many regions, but also that heatwaves will occur more often and last longer. The former will increase global flood risk (Hirabayashi et al., 2013), while the latter is expected to make droughts more intense (Trenberth et al., 2014). These risks are unevenly distributed geographically, and are generally larger for vulnerable people and communities in countries at all levels of development (IPCC, 2014a). Figure 1. Global water withdrawals throughout the previous centuryFigure 2. Climate change scenario trends in water availabilityFigure 3. Annual baseline water stressFigure 4. Seasonal variabilityFigure 5. World weather-related natural catastrophes by peril, 1980–2018Figure 6. Spatial distribution of water-related disasters (droughts, floods, landslides and storms), 2001–2018Figure 7. Spatial distribution of floods, 2001–2018Figure 8. Spatial distribution of droughts, 2001–2018Figure 9. Electricity consumption in the water sector by process, 2014–2040Figure 10. Number of people living under water stress under the Baseline Scenario [Faits et chiffres] Rapport mondial des Nations Unies sur la mise en valeur des ressources en eau 2020: l'eau et les changements climatiques, faits et chiffres Year of publication: 2020 Author: Engin Koncagül | Michael Tran | Richard Connor Corporate author: UNESCO World Water Assessment Programme (WWAP) Depuis le milieu du 20e siècle, on a observé des changements dans l’intensité et la fréquence des phénomènes météorologiques et climatiques extrêmes, notamment une diminution des extrêmes de température froide et une augmentation des extrêmes de température chaude, des niveaux de mer extrêmement élevés et du nombre de fortes précipitations dans un certain nombre de régions (Min et al., 2011).Les projections climatiques indiquent avec une grande confiance que les précipitations extrêmes deviendront plus intenses et plus fréquentes dans de nombreuses régions, mais aussi que les vagues de chaleur seront plus fréquentes et dureront plus longtemps. Les premières augmenteront le risque d’inondation au niveau mondiale (Hirabayashi et al., 2013), tandis que les dernières devraient rendre les sécheresses plus intenses (Trenberth et al., 2014). Ces risques sont répartis géographiquement de façon inégale et ils sont généralement plus importants pour les personnes et les communautés vulnérables dans les pays à tous les niveaux de développement (GIEC, 2014a). Figure 1. Préèements d’eau dans le monde au cours du 20e sièleFigure 2. Tendances des scéarios de changement climatique en matièe de disponibilitéde l’eauFigure 3. Stress hydrique annuel de référenceFigure 4. VariabilitésaisonnièeFigure 5. Catastrophes naturelles mondiales liées au climat, par risque et par nombre d’événements pertinents,1980–2018Figure 6. Réartition spatiale des catastrophes liés àl’eau (séheresses, inondations, glissements de terrain et tempêes) 2001–2018Figure 7. Répartition spatiale des inondations, 2001–2018Figure 8. Répartition spatiale de sécheresses, 2001–2018Figure 9. Consommation d’électricité dans le secteur de l’eau, par procédé, 2014–2040Figure 10. Nombre de personnes en situation de stress hydrique selon le scénario de référence
  [Executive Summary] The United Nations World Water Development Report 2024: Water for Prosperity and Peace Year of publication: 2024 Author: Richard Connor Corporate author: UNESCO World Water Assessment Programme (WWAP) This is the executive summary of the 2024 edition of the United Nations World Water Development Report (UN WWDR). [요약보고서] 2024년 유엔 세계물개발보고서: 번영과 평화를 위한 물 Year of publication: 2024 Author: Richard Connor Corporate author: UNESCO World Water Assessment Programme (WWAP) 누구나 안전하고 공평하게 물을 이용할 수 있도록 개발하고 관리하는 것은, 번영과 평화를 위한 초석이다. 그러나 빈곤과 불평등, 사회적 긴장과 갈등으로 인해 물 안보가 저해됨에 따라 번영과 평화가 약화되는 부작용이 초래되기도 한다. 본 보고서는 지속가능한 물 관리와 번영, 평화 간의 복잡한 상호관계에 주목하여, 어느 한 부문에서의 진보과정이 다른 부문들에게 어떻게 긍정적이고, 때로는 필수적인 영향을 미치는지에 대해 설명하고자 한다.
  [Facts and Figures] The United Nations World Water Development Report 2019: Leaving No One Behind; Facts and Figures Year of publication: 2019 Author: Engin Koncagül | Michael Tran | Richard Connor | Stefan Uhlenbrook Corporate author: UNESCO World Water Assessment Programme (WWAP) Water availability and demandFigure 1 provides a global overview of countries experiencing different levels of water stress (the ratio of total freshwater withdrawn annually by all major sectors, including environmental water requirements, to the total amount of renewable freshwater resources, expressed as a percentage).Over 2 billion people live in countries experiencing high water stress. Recent estimates show that 31 countries experience water stress between 25% (which is defined as the minimum threshold of water stress) and 70%. Another 22 countries are above 70% and are therefore under serious water stress (UN, 2018a).Growing water stress indicates substantial use of water resources, with greater impacts on resource sustainability, and a rising potential for conflicts among users.It has been estimated that about 4 billion people, representing nearly two-thirds of the world population, experience severe water scarcity during at least one month of the year (Mekonnen and Hoekstra, 2016).
  [Summary] The United Nations World Water Development Report 2019: Leaving No One Behind; Executive Summary Year of publication: 2019 Author: Richard Connor | Stefan Uhlenbrook | Engin Koncagül Corporate author: UNESCO World Water Assessment Programme (WWAP) People from different groups are ‘left behind’ for different reasons. Discrimination, exclusion, marginalization, entrenched power asymmetries and material inequalities are among the main obstacles to achieving the human rights to safe drinking water and sanitation for all and realizing the water-related goals of the 2030 Agenda. Poorly designed and inadequately implemented policies, inefficient and improper use of financial resources, as well as policy gaps fuel the persistence of inequalities in access to safe drinking water and sanitation. Unless exclusion and inequality are explicitly and responsively addressed in both policy and practice, water interventions will continue to fail to reach those most in need and who are likely to benefit most.Improving water resources management and providing access to safe and affordable drinking water and sanitation for all is essential for eradicating poverty, building peaceful and prosperous societies, and ensuring that ‘no one is left behind’ on the road towards sustainable development. These goals are entirely achievable, provided there is a collective will to do so. [Resumen] Informe Mundial de las Naciones Unidas sobre el Desarrollo de los Recursos Hídricos 2019:no dejar a nadie atrás, resumen ejecutivo Year of publication: 2019 Author: Richard Connor | Stefan Uhlenbrook | Engin Koncagül Corporate author: UNESCO World Water Assessment Programme (WWAP) Personas de distintos grupos “se quedan atrás” por diferentes motivos. Discriminación, exclusión, marginación, asimetrías de poder arraigadas y desigualdades materiales se encuentran entre los principales obstáculos para lograr los derechos humanos al agua potable segura y al saneamiento para todos y para alcanzar los objetivos relacionados con el agua de la Agenda 2030. Las políticas mal diseñadas y aplicadas de manera inadecuada, un uso ineficaz e inadecuado de los recursos financieros, así como las brechas en las políticas, alimentan la persistencia de las desigualdades en el acceso al agua potable segura y al saneamiento. A menos que la exclusión y la desigualdad se aborden de forma explícita y responsable tanto en las políticas como en la práctica, las intervenciones sobre el agua seguirán fracasando a la hora de llegar a los más necesitados y a quienes probablemente beneficiarían más.Mejorar la gestión de los recursos hídricos y facilitar el acceso al agua potable y saneamiento seguros y asequibles para todo el mundo es esencial para erradicar la pobreza, construir sociedades pacíficas y prósperas y garantizar que “no dejar a nadie atrás” en el camino hacia un desarrollo sostenible. Estos objetivos son plenamente alcanzables, siempre que exista la voluntad colectiva de hacerlo. [Résumé] Rapport mondial des Nations Unies sur la mise en valeur des ressources en eau 2019: ne laisser personne pour compte; résumé Year of publication: 2019 Author: Richard Connor | Stefan Uhlenbrook | Engin Koncagül Corporate author: UNESCO World Water Assessment Programme (WWAP) Le fait que des personnes de différents groupes soient « laissées pour compte » s’explique par plusieurs facteurs. La discrimination, l’exclusion, la marginalisation, des rapports de force asymétriques et les inégalités matérielles figurent parmi les principaux obstacles à la réalisation des droits de l’homme à l’eau potable et à l’assainissement pour tous et aux objectifs du Programme 2030 relatifs à l’eau. En outre, la mauvaise conception des politiques et leur application insuffisante, l’utilisation inefficace et inadéquate des ressources financières, ainsi que les lacunes politiques, alimentent les inégalités dans l’accès à l’eau potable et à l’assainissement. Si l’exclusion et l’inégalité ne sont pas traitées de manière explicite et adaptée dans les politiques et les pratiques, les interventions dans le domaine de l’eau continueront de ne pas bénéficier à ceux qui en ont le plus besoin et qui sont susceptibles d’en tirer le plus profit.Améliorer la gestion des ressources en eau et garantir l’accès universel à une eau potable et à des installations sanitaires sécuritaires, à un coût abordable, sont essentiels pour éliminer la pauvreté, bâtir des sociétés pacifiques et prospères et assurer de « ne laisser personne pour compte » sur la voie du développement durable. Ces objectifs sont tout à fait réalisables, à condition qu’il y ait une volonté collective d’agir. [요약보고서] 2019년 UN 세계물개발보고서: 누구도 소외되지 않는 사회; 요약보고서 Year of publication: 2019 Author: Richard Connor | Stefan Uhlenbrook | Engin Koncagül Corporate author: UNESCO World Water Assessment Programme (WWAP) 여러 그룹의 사람들은 다양한 이유로 ‘소외’되고 있다. 차별, 배제, 소외, 집권층 권력의 불균형 및 경제적 불평등은 안전한 식수 및 위생에 대한 인권을 달성하고, 2030 아젠다의 물 관련 목표를 실현하는 데 있어 걸림돌이 된다. 설계가 잘못되고, 부적절하게 구현된 정책, 비효율적이고 부당한 재정 자원 사용과 더불어 정책 격차는 안전한 식수 및 위생 시설 접근에 대한 불평등을 지속시킨다. 배제와 불평등 문제가 정책과 실행에서 분명하고, 신속하게 고려되지 않는다면, 물조정 노력 (water interventions)은 물을 가장 필요로 하고 혜택을 가장 많이 받을 수 있는 사람들에게 계속해서 그 효과를 주지 못할 것이다.수자원 관리를 개선하고 모든 사람에게 안전하고 경제적인 식수 및 위생 시설을 제공하는 것은 빈곤 퇴치, 평화롭고 번영하는 사회 형성, 지속 가능한 발전을 위한 ‘누구도 소외되지 않는 사회’ 구축에 필수적이다. 이러한 목표는 공동의 의지가 있는 한 전적으로 달성 가능할 것이다. [Pабочее резюме] Всемирный доклад Организации Объединенных Наций о состоянии водных ресурсов, 2019 г. : Не оставляя никого в стороне, рабочее резюме Year of publication: 2019 Author: Richard Connor | Stefan Uhlenbrook | Engin Koncagül Corporate author: UNESCO World Water Assessment Programme (WWAP) Представители различных групп «бывают забыты» по разным причинам. Дискриминация, отчуждение, маргинализация, укоренившаяся асимметричность в распределении власти, материальное неравенство – все это относится к числу основных препятствий на пути соблюдения права человека на безопасную питьевую воду и санитарию для всех, а также реализации связанных с водными ресурсами целей, поставленных в Повестке-2030.Плохо разработанная и неумело осуществляемая политика, бесхозяйственное и нецелевое использование финансовых ресурсов, а также пробелы в политике подпитывают сохранение неравенства в сфере доступа к водным ресурсам и санитарии. Если для решения проблем отчуждения и неравенства в политике и на практике не будут приниматься конкретные и ответственные меры, связанные с водными ресурсами мероприятия по-прежнему не будут отвечать интересам наиболее нуждающихся слоев и тех, кто должен быть их основными бенефициарами.Совершенствование управления водными ресурсами и обеспечение всеобщего доступа к безопасной и финансово доступной питьевойводе и санитарии имеет существенно важное значение для искоренения нищеты, созидания мирных и процветающих обществ и обеспечения такого положения, при котором «никто не будет забыт» на пути, ведущем к устойчивому развитию. При наличии коллективной воли эти цели вполне достижимы.